No data story is too complex
Create charts that captivate your audience, perfect for anyone who wants to make their data sing. Customize it while keeping consistent with your design theme.
Get Started with Chart Plus

Advanced Visualizations
Unlock a world of possibilities with D3.js integration
Easy to Use
Simple interface for creating custom charts
Perfect Integration
Seamlessly works within your Canva designs
What Chart Plus Does
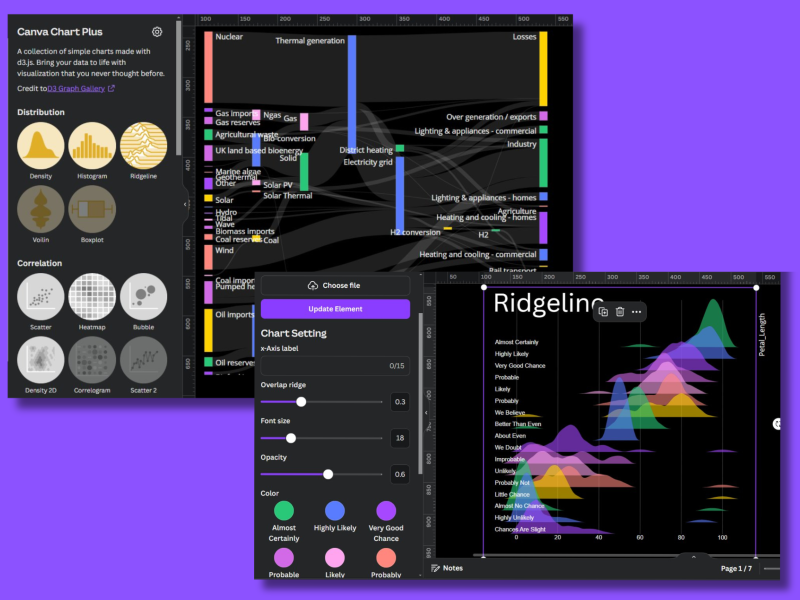
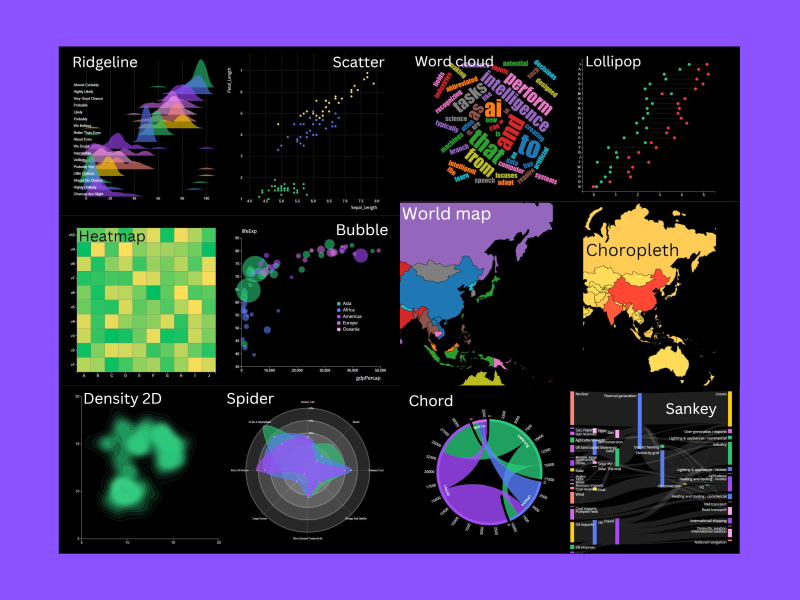
Chart Plus elevates your Canva designs with advanced visualizations. By integrating the powerful D3.js library with Canva, we've unlocked a world of possibilities that go beyond basic charts. Our app enables users to create stunning, custom graphs that bring data to life, making it perfect for engineers, storytellers, salespeople, and anyone seeking to enhance their data presentation.
The simple-to-use and tailor-made chart interface allows users to easily deploy their data in the form of charts for their design work.
See Chart Plus in Action
Connect with Us
Check out our Hackathon Project
See how Chart Plus started as a hackathon idea and evolved into a powerful tool.
View our Devpost Project